Performance Tuning
Performance Tuning Your Builds
Buck does a lot of work to make builds as fast as possible, and we also give developers tools to figure out where the time is being spent inside of their builds.Super Console
When running Buck in an Ansi compliant terminal, Buck displays the break down of what each thread is doing, updated every 100ms, in what we affectionately call "SuperConsole." While a build is running, this gives developers a good idea of what Buck is spending its time doing, and can often help people spot issues in their builds. If you want to see what happened after the fact or to have a trace you can send around your team, use Chrome Tracing.
Chrome Tracing
 The Chrome team has built an awesome framework for viewing performance traces right inside of Chrome. You can access this by going to
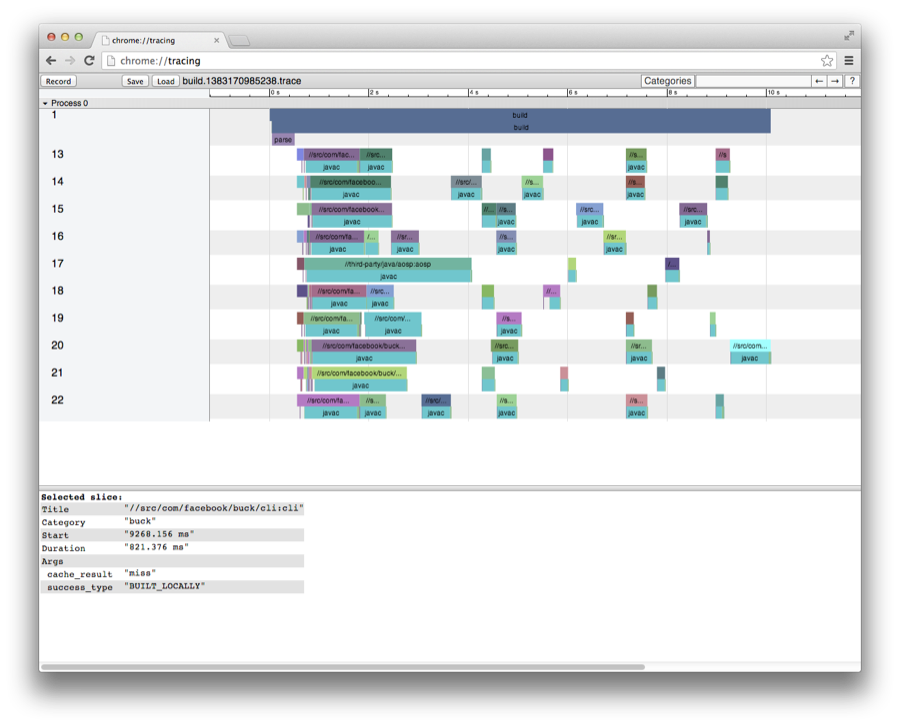
 chrome://tracing in your browser. Consult the trace viewer's project page for more information on the trace viewer and the file format.After Buck is done with each build, it will produce a Chrome Trace file that can be loaded up in chrome://tracing in the directory buck-out/log/traces/. Buck will save a file in the format build.[timestamp].trace, and then create a symlink from the most recent trace to build.trace.
To load up this trace, visit chrome://tracing inside of Chrome, and hit "Load". Load the trace file of interest, and look around to see where time was spent. Each row represents a different thread, and all of the steps taken for a given rule are logged underneath that rule. Additionally, we log information about how the rule was built and and the rule key for each artifact fetch. Press ? to get the help menu for the Chrome Trace Viewer.